Cheapest and Most Expensive States for Electricity
See which states have the cheapest and most expensive residential electricity, with July 2026 EIA prices, example monthly bills and year-over-year changes.
Published 4 min readRoofPayback editorialChecked by automated fact and quality checks
Official data: EIA · DOE · IRS · how we check
In this article · 8 sections
Short answer
Right now, Louisiana and Nevada have the cheapest residential electricity in the U.S. Louisiana averages 12.72¢ per kWh and Nevada 12.77¢ (EIA, July 2026). Hawaii is the most expensive at 48¢, followed by California at 33.61¢ and Maine at 32.41¢.
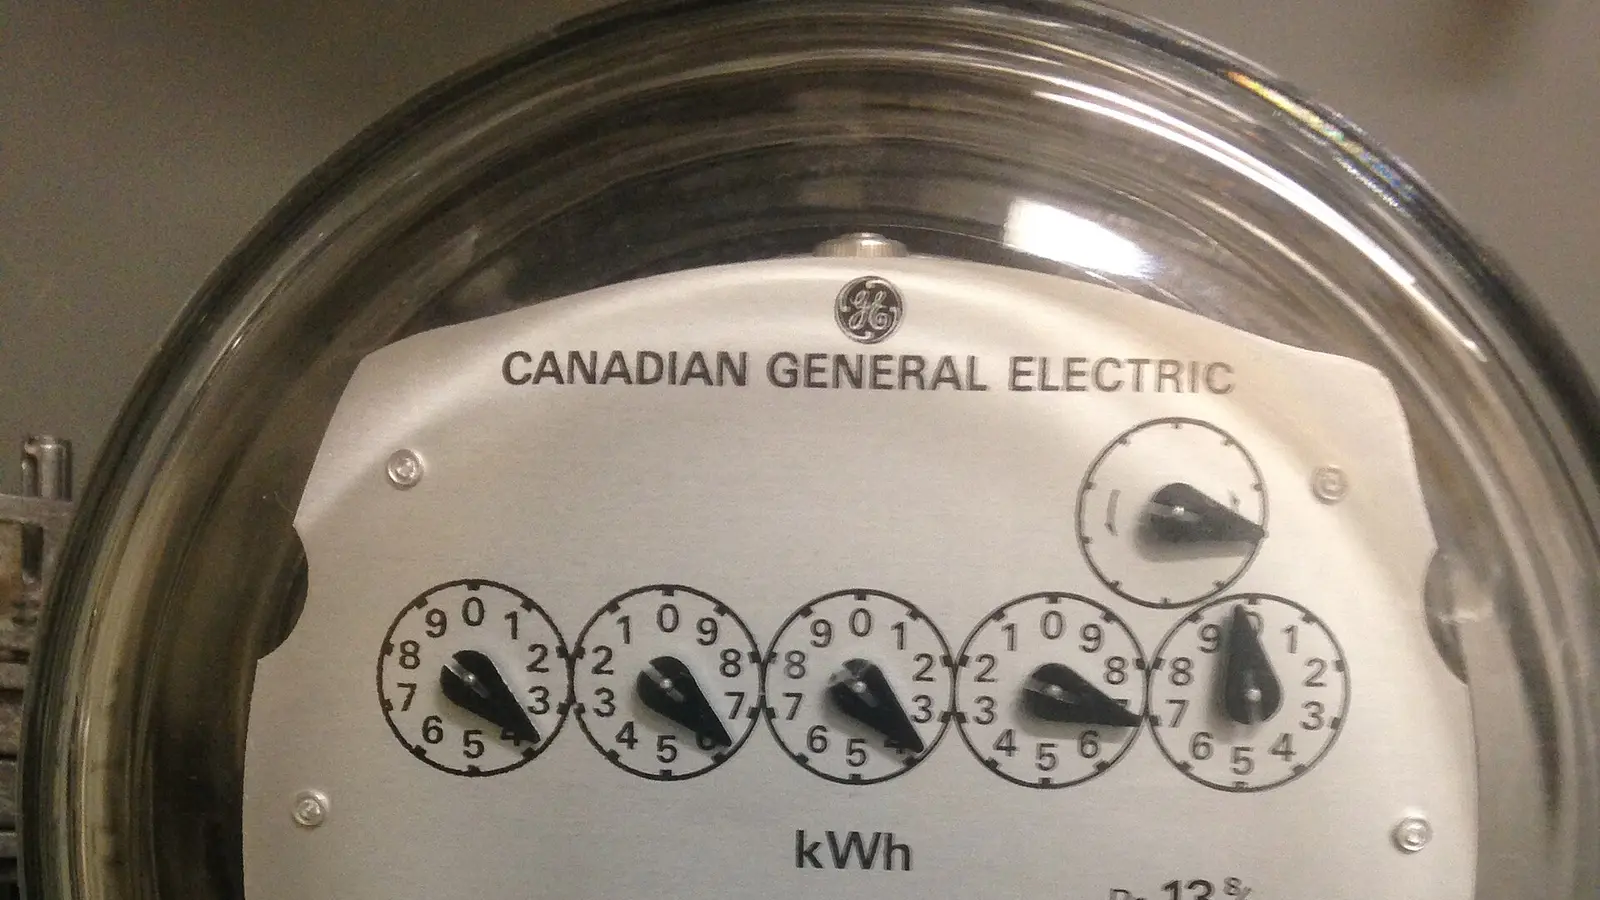
A kWh (kilowatt-hour) is the unit your utility bills you for. See what a kilowatt-hour is if the term is new to you. The gap between the cheapest and priciest states is large. For the same 900 kWh in a month, the example bill is about $114 in Louisiana and about $432 in Hawaii.
Where these prices come from
The U.S. Energy Information Administration (EIA) publishes average residential prices by state each month in the Electric Power Monthly, Table 5.6.A. Recent months are preliminary, so numbers can change a little.
Each state price is total utility revenue divided by kWh sold. That means it includes taxes and fees, and it is an average. Your own bill depends on your utility, your rate plan and how much power you use. Use your own bill as the final check.
The cheapest states
These states have the lowest average residential prices in the July 2026 data:
| State | Price (July 2026) | Example bill, 900 kWh/month | Change vs. a year earlier |
|---|---|---|---|
| Louisiana | 12.72¢ | $114 | -3% |
| Nevada | 12.77¢ | $115 | 3.1% |
| Utah | 13.12¢ | $118 | -2.5% |
| North Dakota | 13.41¢ | $121 | 0.8% |
| Tennessee | 13.71¢ | $123 | 3.8% |
| Idaho | 13.73¢ | $124 | 11.8% |
| Nebraska | 13.78¢ | $124 | 7.3% |
| Kentucky | 13.81¢ | $124 | 5.2% |
The example bill assumes 900 kWh per month at the state's average price. It is not a quote. Real bills vary with rate structure, usage and utility.
Only Louisiana and Utah in this group got cheaper over the year. Idaho's price rose faster than most of the table.
The most expensive states
| State | Price (July 2026) | Example bill, 900 kWh/month | Change vs. a year earlier |
|---|---|---|---|
| Hawaii | 48¢ | $432 | 22% |
| California | 33.61¢ | $302 | 2.9% |
| Maine | 32.41¢ | $292 | 15.8% |
| Massachusetts | 30.49¢ | $274 | 1.4% |
| New York | 29.9¢ | $269 | 14% |
| Alaska | 28.83¢ | $259 | 5.6% |
| Rhode Island | 28.29¢ | $255 | 8.1% |
| New Hampshire | 26.6¢ | $239 | 16.7% |
Hawaii stands apart. Its price is well above every mainland state. For the reasons behind gaps like this, read why electricity prices differ by state.
Which prices moved most in a year
Price changes matter as much as the level. A state that is cheap today can climb quickly.
Biggest increases in the data:
- Hawaii: 22%
- New Hampshire: 16.7%
- Maine: 15.8%
- New York: 14%
- Maryland: 13.7%
- North Carolina: 13.4%
Biggest drops:
- Connecticut: -12.5%
- Louisiana: -3%
- Utah: -2.5%
- Wyoming: -1.9%
One month of data is a snapshot. A year-over-year change from a single July can be affected by weather, fuel costs and rate cases. Do not treat it as a forecast.
What this means for your monthly bill
Price per kWh is only half of the story. Your bill also depends on how many kWh you use. A hot-climate home with heavy air conditioning can use far more power than a mild-climate home. A cheap price does not always mean a cheap bill.
Electric vehicle owners feel the difference too. Charging at home with 3500 kWh a year costs about $445 in Louisiana and about $1680 in Hawaii in our example. See home EV charging cost by state for the full list, and average electric bill by state for typical bills.
To estimate your own bill, try the electricity cost calculator. To look up any state, start at electricity prices by state.
What it means for rooftop solar
Solar saves money by replacing kWh you would have bought. So the higher your price, the more each solar kWh is worth. That is why high-price states often show faster payback in our model, even when they get less sun.
Our example home uses these assumptions: a 7 kW system, 10500 kWh per year of use, 40% of use while the sun is up, $3000 per kW installed ($21000 total), no incentives, $100 per year maintenance, electricity price rising 2.5% per year, panel degradation of 0.5% per year, and a 25-year horizon. Export credits are capped at a year of grid purchases with an annual true-up. Production comes from PVWatts, the free estimator from the U.S. Department of Energy's National Laboratory of the Rockies.
Two cautions apply:
- The 30% federal Residential Clean Energy Credit (Section 25D) is not available for property placed in service after December 31, 2025, per the IRS. Read is solar worth it without the tax credit.
- Net metering and similar programs vary by state and utility. DSIRE keeps a database of current programs, and net metering vs. net billing explains why the rules change the math.
For our ranking of states by payback, see best states for solar payback. To test your own numbers, use the solar calculator. Our methodology page shows how we calculate.
Bottom line
Louisiana, Nevada and Utah sit near the bottom of the price table, while Hawaii, California and Maine sit at the top. The same 900 kWh costs very different amounts depending on where you live.
Use these averages as a starting point, not a quote. Check your own utility's rate, your usage and the rules in your state. If your price is high, solar may be worth a closer look. If it is low, the case is weaker and depends more on your own numbers.
Sources
Get new articles by email
New articles and the monthly electricity price update. Unsubscribe anytime.
See our privacy policy.