Why Electricity Prices Differ So Much by State
Home electricity ran from 12.72¢ to 48¢ per kWh across states in July 2026. Here is what drives the gap, explained with EIA data.
Published 6 min readRoofPayback editorialChecked by automated fact and quality checks
Short answer
Electricity costs more in some states because it costs more to make and deliver power there. The U.S. Energy Information Administration (EIA) says prices vary by place "based on the availability of power plants and fuels, local fuel costs, and pricing regulations." Weather, the cost of the grid, and how a state regulates its utilities all play a part.
The gap is large. In July 2026, the average home in Hawaii paid 48¢ per kilowatt-hour (kWh). A kWh is the unit on your bill: an appliance that draws one kilowatt, run for one hour, uses one kWh. In Louisiana, the average home paid 12.72¢ per kWh in the same month. Those are state averages from EIA. Your own rate depends on your utility and your plan.
How big is the gap between states?
EIA publishes the average residential price for every state each month in its Electric Power Monthly (Table 5.6.A). Recent months are preliminary, so the numbers can be revised. Here are the highest and lowest states for July 2026.
| State | Average home price, July 2026 | A year earlier |
|---|---|---|
| Hawaii | 48¢ | 39.36¢ |
| California | 33.61¢ | 32.66¢ |
| Maine | 32.41¢ | 27.98¢ |
| Massachusetts | 30.49¢ | 30.07¢ |
| New York | 29.9¢ | 26.22¢ |
| Alaska | 28.83¢ | 27.3¢ |
| Idaho | 13.73¢ | 12.28¢ |
| Tennessee | 13.71¢ | 13.21¢ |
| North Dakota | 13.41¢ | 13.31¢ |
| Utah | 13.12¢ | 13.45¢ |
| Nevada | 12.77¢ | 12.39¢ |
| Louisiana | 12.72¢ | 13.12¢ |
You can see your own state on our electricity prices by state page. For example, Hawaii and Louisiana each have their own page.
What goes into the price of electricity
EIA says electricity prices "generally reflect the cost to build, finance, maintain, and operate power plants and the electricity grid." The grid is the network of transmission and distribution lines that carries power from plants to homes. EIA also notes that some for-profit utilities include a return for owners and shareholders in their prices.
So your rate pays for three big things:
- Making the power. EIA says "The cost of generating electricity is the largest component of the price of electricity." This includes fuel and the cost of the power plants.
- Moving the power. Transmission and distribution lines cost money to build, run and repair, including after storms and accidents.
- Running the utility. Billing, customer service and, for some utilities, a profit.
When any of these costs is higher in one state than another, home prices tend to be higher too.
The main reasons prices differ by state
Fuel: what the power plants burn
Fuel is a big driver. EIA explains that fuel prices, "especially for natural gas and petroleum fuels (mainly in Hawaii and villages in Alaska), may increase during periods of high electricity demand." When fuel costs rise, the cost to make electricity rises too.
Hawaii is the clearest example. EIA says prices there are high "mainly because most of its electricity is generated with petroleum fuels that must be imported into the state." That helps explain why Hawaii tops the table at 48¢, up from 39.36¢ a year earlier. Alaska, at 28.83¢, also has villages that rely on petroleum fuels, according to EIA.
Local resources: water and wind
Some places have cheap natural resources for making power. EIA notes that "Rain and snow provide water for low-cost hydropower generation, and wind can provide low-cost electricity generation when wind speeds are favorable." The flip side, EIA says, is that droughts or calm winds can push prices up because other sources must fill the gap.
The grid and delivery costs
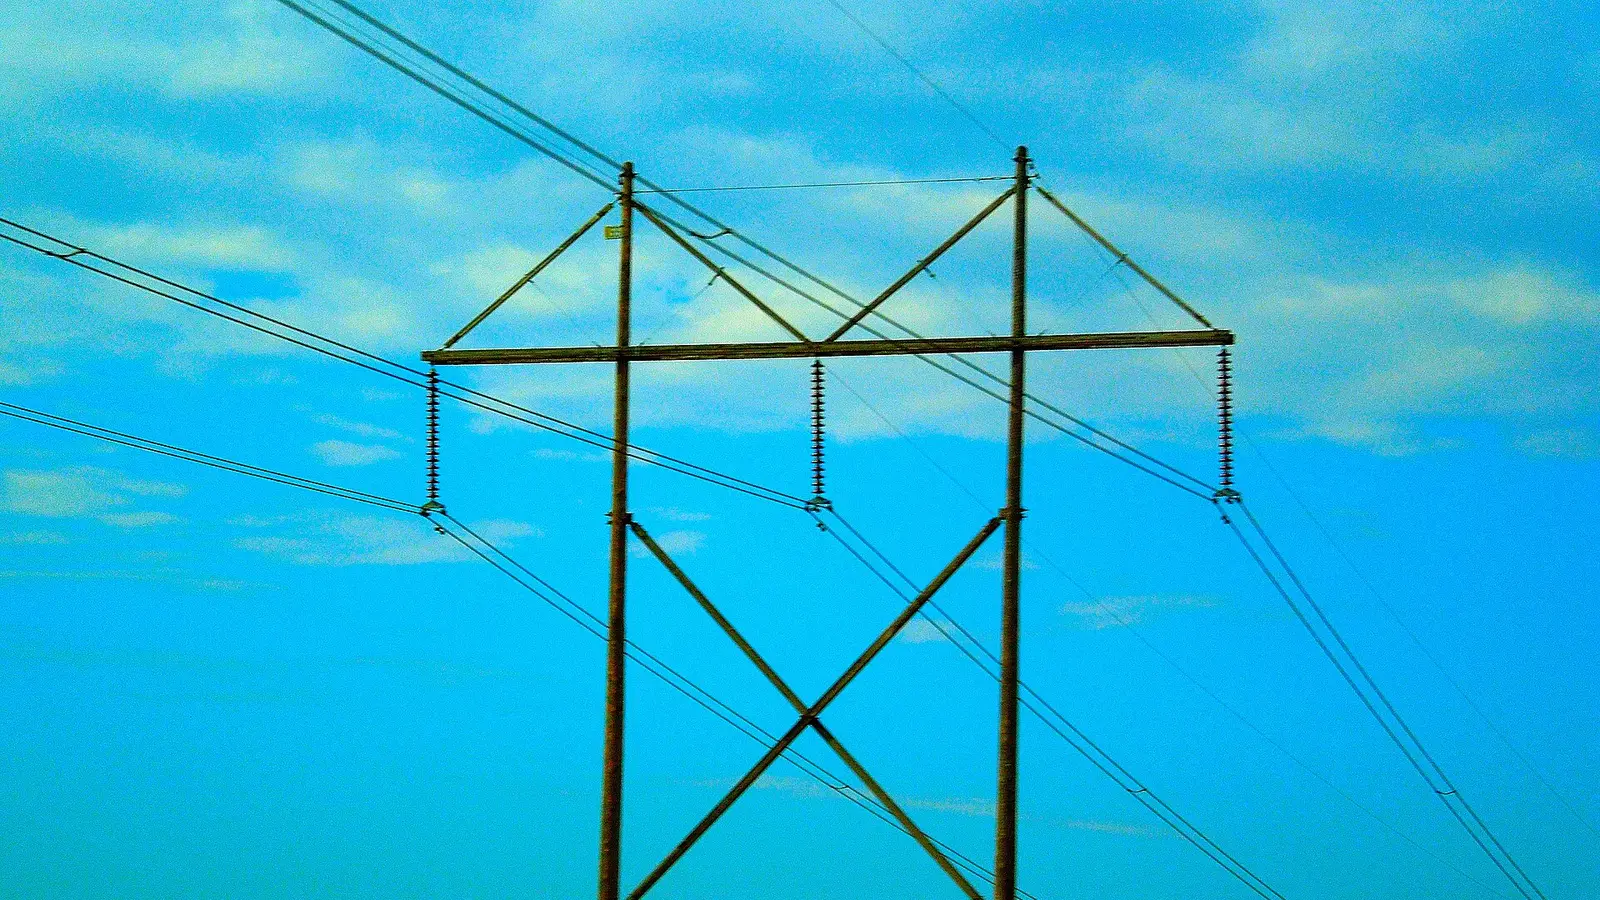
Every state has to pay for poles, wires and substations. EIA lists repairing damage from accidents or extreme weather and improving cybersecurity among those costs. Where it costs more to build and keep up the grid, those costs show up on home bills.
Delivery is also why homes pay more than factories. EIA says "Retail electricity prices are usually highest for residential and commercial consumers because it costs more to distribute electricity to them." You can see this in every region below: the residential price is higher than the industrial price.
Weather and demand
EIA says "Extreme temperatures can increase demand for heating and cooling," and higher demand can raise fuel and electricity prices. Prices are usually highest in summer, when more expensive power plants are added to meet demand. July is a summer month, so July prices can be higher than a full-year average.
How the state regulates prices
States set their own rules. EIA explains: "In some states, public service (utility) commissions fully regulate prices, and other states have a combination of unregulated prices (for generators) and regulated prices (for transmission and distribution)." These choices shape how prices are set.
Prices by region
States near each other often have similar prices. EIA groups states into census divisions. Here are July 2026 averages in cents per kWh.
| Region | Residential | A year earlier | Commercial | Industrial |
|---|---|---|---|---|
| Pacific Noncontiguous (Alaska, Hawaii) | 40.76¢ | 34.77¢ | 34.32¢ | 35.55¢ |
| New England | 28¢ | 27.89¢ | 22.6¢ | 17.97¢ |
| Pacific Contiguous | 27.14¢ | 25.99¢ | 23.94¢ | 18.01¢ |
| Middle Atlantic | 25.71¢ | 23.53¢ | 20.14¢ | 11.41¢ |
| East North Central | 19.57¢ | 17.8¢ | 14.65¢ | 10.49¢ |
| South Atlantic | 16.12¢ | 15.28¢ | 12.26¢ | 9.25¢ |
| West North Central | 15.89¢ | 15.26¢ | 11.96¢ | 9.65¢ |
| West South Central | 15.21¢ | 14.71¢ | 9.1¢ | 7.07¢ |
| Mountain | 14.92¢ | 14.59¢ | 12.14¢ | 8.38¢ |
| East South Central | 14.61¢ | 13.99¢ | 13.49¢ | 7.74¢ |
The pattern is clear. Alaska and Hawaii, New England, the West Coast and the Middle Atlantic pay the most. The South and the Mountain West pay the least.
One exception stands out. In Alaska and Hawaii combined, the industrial price (35.55¢) was higher than the commercial price (34.32¢) in July 2026. In every other region, businesses paid more than industry. Homes still paid the most everywhere.
Prices also change over time
A state's place in the ranking can shift from year to year. Some states saw big jumps between July 2025 and July 2026. Hawaii rose 22%. New Hampshire rose 16.7%, to 26.6¢. Maine rose 15.8%. Others went down: Connecticut fell 12.5%, to 24.16¢, and Louisiana fell 3%.
For a fuller look at the latest month, see our July 2026 electricity price guide.
What this means if you are thinking about solar
When you pay more for each kWh, every kWh you avoid buying is worth more. That is one reason rooftop solar tends to pay back faster in high-price states. But the price is only part of the story. Sunshine, the cost of the system, and your utility's rules for solar credits also matter. Net metering, where your utility credits the power you send back to the grid, varies by state and utility. The DSIRE database lists current programs.
Also note that the 30% federal Residential Clean Energy Credit is not available for property placed in service after December 31, 2025. Our guide to solar without the tax credit covers what that means.
To test your own numbers, try the solar calculator. It uses your state's EIA price and a PVWatts production estimate. Our example home assumes a 7 kW system, 10,500 kWh per year of use, an installed cost of $3,000 per kW ($21,000 total) and no incentives. See our methodology for the full list of assumptions. Your real results depend on your quote and your utility.
Bottom line
Electricity prices differ by state because the costs behind them differ: fuel, power plants, the grid, weather and state rules. Hawaii pays the most, largely because it burns imported petroleum fuels. Louisiana, Nevada and Utah were among the cheapest in July 2026. To see what you pay, check your state on our electricity prices page, then look at your own bill. Your utility's rate is the number that matters most for you.
Sources
Get new articles by email
New articles and the monthly electricity price update. Unsubscribe anytime.
See our privacy policy.