Solar Panels in Winter: Output by State vs. Summer
How much do solar panels make in winter? Winter vs. summer output per kW for U.S. states, why the gap grows up north, and what it means for net metering.
Published 6 min readRoofPayback editorialChecked by automated fact and quality checks
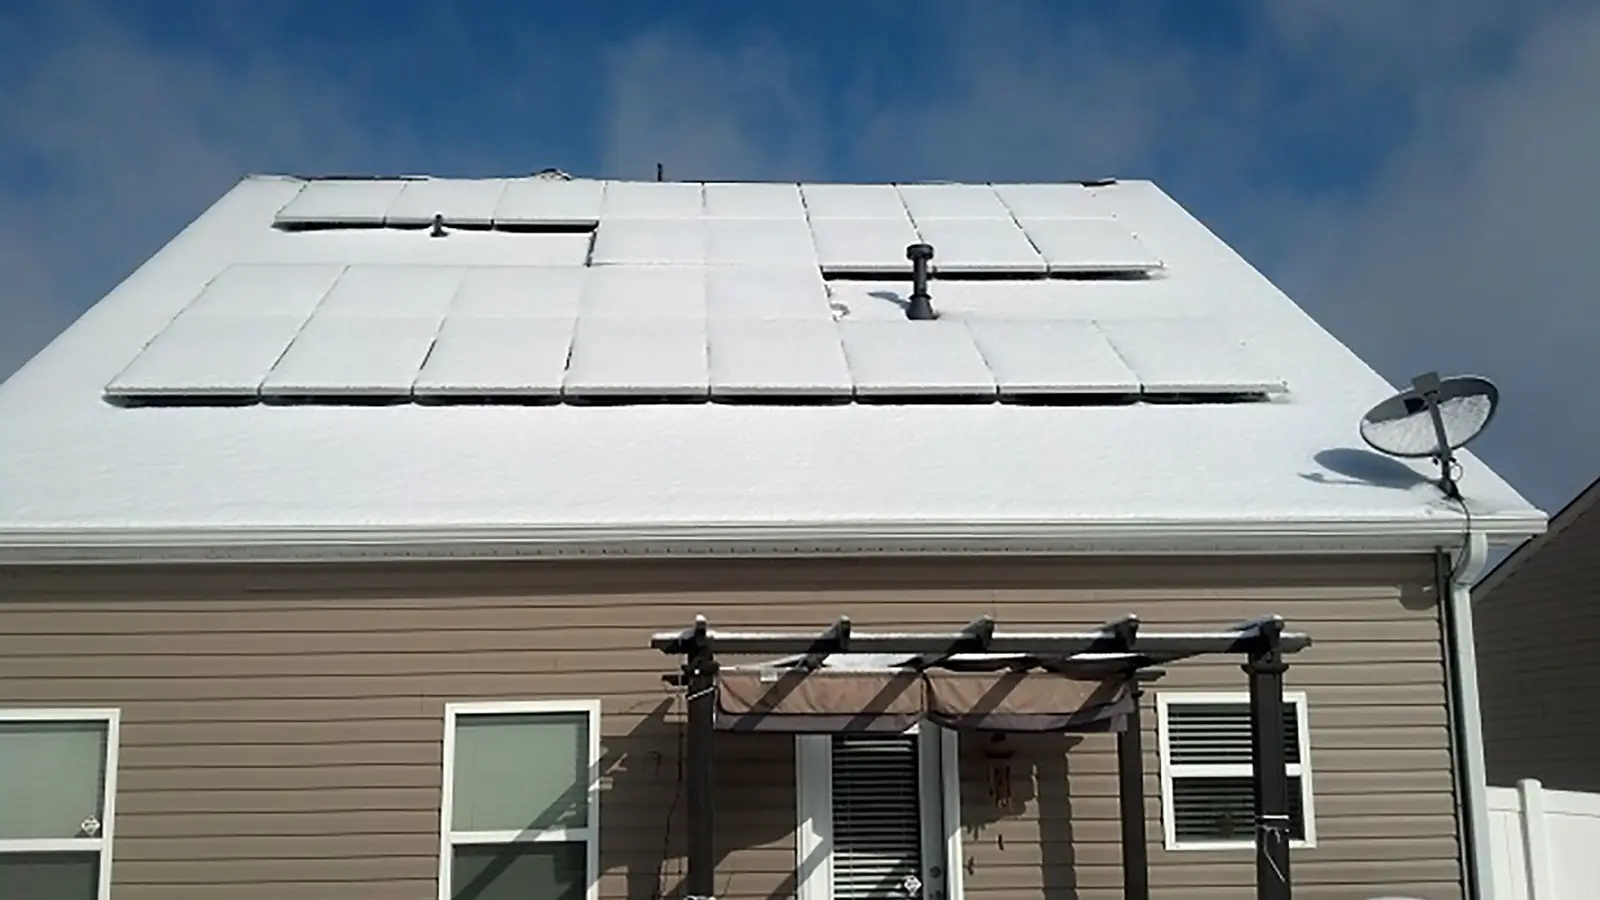
Short answer
Solar panels keep working in winter, but they make less electricity than in summer. How much less depends a lot on where you live. In our numbers, a kilowatt (kW) of panels in Florida makes 332 kWh over December, January and February, versus 395 kWh over June, July and August. That is a summer/winter ratio of just 1.2. In Washington, the same kilowatt makes 128 kWh in winter and 417 kWh in summer, a ratio of 3.3. In Alaska the ratio is 6.6.
A kWh (kilowatt-hour) is the unit on your electric bill. It is the energy a 1 kW device uses if it runs for one hour.
If your utility lets you carry credits from sunny months into dark months, a weak winter matters less than it sounds. If it does not, winter output matters more. Check your own utility's rules before you decide.
Why panels make less in winter
The U.S. Energy Information Administration (EIA) explains the basics. Sunlight is strongest "at solar noon—on clear, cloudless days." In winter the sun sits lower in the sky and the days are shorter, so there is less of it to catch.
Location also matters. The EIA notes that "Locations in lower latitudes and in arid climates generally receive higher amounts of insolation than other locations." Insolation is simply the amount of sunlight that reaches a surface over a period of time. Weather plays a role too: "Clouds, dust, volcanic ash, and pollution in the atmosphere affect insolation levels at the surface."
The key point for winter is this line from the EIA: "Seasonal (monthly) variations in solar resources increase with increasing distance from the earth's equator." In plain words, the farther north you are, the bigger the gap between summer and winter. That pattern shows up clearly in the state numbers below.
How we got these numbers
Every figure here comes from PVWatts, a free solar production estimator from the U.S. Department of Energy's National Laboratory of the Rockies (formerly NREL). We used PVWatts v8 with panels facing south, a 20° roof pitch, and 14% system losses. We picked one reference city per state, so a home in a different part of your state can see different results.
For each state we show:
- Winter: output per kW of panels for December, January and February combined.
- Summer: output per kW for June, July and August combined.
- Ratio: summer output divided by winter output. A ratio of 1.5 means summer makes one and a half times as much as winter.
These are modeled estimates for a typical year, not a promise. Shade, snow cover, roof angle, and your actual equipment all change the result. You can read more on our methodology page.
Winter vs. summer output by state
Here is a selection of states, from the smallest seasonal gap to the largest. All numbers are per kW of panels.
| State | Winter kWh (Dec-Feb) | Summer kWh (Jun-Aug) | Summer/winter ratio | January kWh | July kWh |
|---|---|---|---|---|---|
| Florida | 332 | 395 | 1.2 | 117 | 132 |
| Hawaii | 357 | 447 | 1.3 | 126 | 151 |
| Arizona | 356 | 483 | 1.4 | 118 | 156 |
| New Mexico | 360 | 490 | 1.4 | 121 | 162 |
| Texas | 267 | 408 | 1.5 | 93 | 140 |
| California | 320 | 507 | 1.6 | 110 | 171 |
| Massachusetts | 230 | 402 | 1.7 | 81 | 143 |
| New York | 233 | 408 | 1.7 | 79 | 141 |
| Minnesota | 231 | 434 | 1.9 | 79 | 157 |
| Ohio | 212 | 420 | 2 | 72 | 144 |
| Illinois | 207 | 442 | 2.1 | 66 | 158 |
| Michigan | 200 | 436 | 2.2 | 65 | 152 |
| Idaho | 188 | 520 | 2.8 | 55 | 180 |
| Oregon | 134 | 423 | 3.2 | 35 | 155 |
| Washington | 128 | 417 | 3.3 | 40 | 143 |
| Alaska | 57 | 372 | 6.6 | 14 | 124 |
A few things stand out:
- The sunniest states stay steady. Florida, Hawaii, Arizona and New Mexico all have ratios of 1.4 or lower. New Mexico, Hawaii and Arizona have the highest winter output per kW in our data.
- Snowy states are not the worst. Minnesota has a ratio of 1.9, and its winter output (231 kWh) is close to New York's (233 kWh).
- The Pacific Northwest has the biggest gap outside Alaska. Oregon (3.2) and Washington (3.3) have the largest ratios in our data outside Alaska. Oregon makes just 35 kWh per kW in January.
- Alaska is in its own class. At 14 kWh per kW in January, winter solar there is close to nothing.
For any state not listed, see its page under solar panels by state. Each state page shows the numbers for its reference city.
What a weak winter means for net metering
Net metering is an arrangement where your utility gives you credit for solar power you send to the grid. The Department of Energy says that "Whether or not your solar system qualifies for net metering payments depends on policies and practices in your state and electric utility."
The details matter most in winter. In summer, your panels often make more than you use, so you export the extra. In winter, you usually buy more from the grid than you export. What happens next depends on how your utility handles credits:
- Credits that roll over to later months. Some programs let credits carry forward and get settled once a year, often called an annual true-up. A low winter then hurts less, because summer surplus can cover part of winter use.
- Credits that are settled each month, or paid at a lower rate. If extra power is credited at less than what you pay for grid power, or does not carry over, your winter bills stay higher. A state with a big seasonal gap feels this the most.
The DOE suggests asking about "availability in your service area, eligible system size and customer type, rates, and design of bill credits." Your utility is the best place to get those answers. The DSIRE database also tracks net metering and incentive programs by state. For a side-by-side look at how these rules change payback, read our guide on net metering vs. net billing.
How we model a full year
Our solar calculator uses these monthly numbers, not just a yearly total. Its example home assumes a 7 kW system, 10500 kWh/yr of use, and 40% of use while the sun is up. Export credits are capped at a year of grid purchases, which matches an annual true-up. It also assumes $3000/kW installed ($21000 total), no incentives, $100/yr maintenance, electricity prices rising 2.5%/yr, panel degradation of 0.5%/yr, and a 25-year horizon. Your utility's real rules may be less generous, so treat the result as a starting point.
Note that the 30% federal Residential Clean Energy Credit (Section 25D) is not available for property placed in service after December 31, 2025. Our guide on whether solar is worth it without the tax credit covers what that means.
Winter output also affects how many panels you might want. If you want to cover more of your winter use, you may need a bigger system, and that only makes sense if your utility credits the summer surplus fairly. Our guide on how many solar panels you need walks through sizing. To see what grid power costs where you live, check electricity prices by state.
Bottom line
Solar panels do produce in winter, but less. In the sunniest states, such as Florida, Hawaii, Arizona and New Mexico, the drop is mild, with ratios from 1.2 to 1.4. In the North it is larger, and in Oregon, Washington and Alaska it is steep. The farther you are from the equator, the bigger the seasonal swing, as the EIA notes.
Whether a dark winter hurts your savings depends mostly on your utility's credit rules. Annual netting smooths out the seasons; monthly settlement or low export rates do not. Get the rules from your utility, get a real quote, and run your own numbers in our solar calculator.
Sources
Get new articles by email
New articles and the monthly electricity price update. Unsubscribe anytime.
See our privacy policy.