Why Homes Pay More for Electricity Than Businesses
Homes paid 18.31¢/kWh in July 2026 vs 9.77¢/kWh for industry, per EIA. See why delivery costs drive the gap and how it varies by state.
Published 5 min readRoofPayback editorialChecked by automated fact and quality checks
Short answer
Homes pay the most per unit of electricity in the U.S. In July 2026, the average residential price was 18.31¢ per kilowatt-hour (kWh), according to the U.S. Energy Information Administration (EIA). Commercial customers, such as stores and offices, paid 14.53¢/kWh. Industrial customers, such as factories, paid 9.77¢/kWh.
The main reason is delivery. The EIA explains that retail prices are usually highest for residential and commercial customers "because it costs more to distribute electricity to them." Big industrial users take power at higher voltages, which is cheaper to supply.
A kilowatt-hour is the unit on your bill. It is the energy a device rated at one kilowatt uses in one hour. The price per kWh is often called your "rate."
The national numbers for July 2026
The EIA publishes average prices by customer type every month in its Electric Power Monthly. Recent months are preliminary, so the figures can be revised later. Here are the July 2026 U.S. averages, with July 2025 for comparison:
| Customer type | July 2026 | July 2025 | Change |
|---|---|---|---|
| Residential (homes) | 18.31¢/kWh | 17.45¢/kWh | 4.9% |
| Commercial (stores, offices) | 14.53¢/kWh | 14.05¢/kWh | 3.4% |
| Industrial (factories, plants) | 9.77¢/kWh | 9.33¢/kWh | 4.7% |
| All sectors | 14.99¢/kWh | 14.36¢/kWh |
Two things stand out. First, the order is the familiar one: homes highest, businesses in the middle, industry lowest. Second, all three went up over the year, and the residential price rose the fastest.
These are averages across the whole country. Your own rate depends on your utility, your plan and your state. For the full state list, see our electricity prices by state page and the July 2026 electricity price guide.
Why homes pay more: delivery costs in plain terms
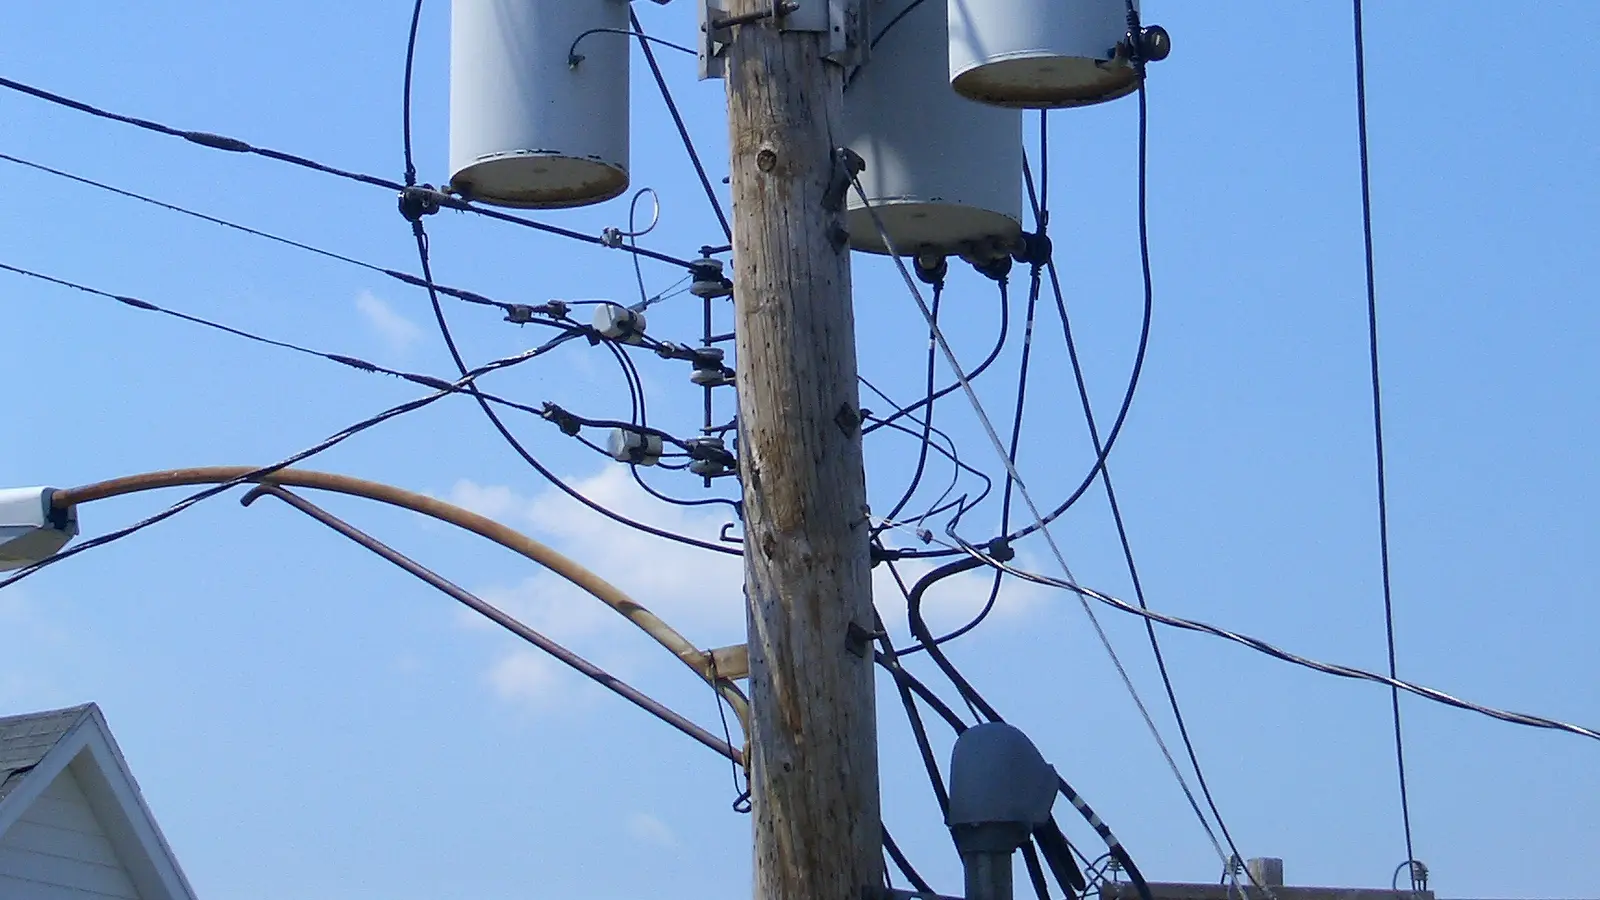
Electricity travels a long way before it reaches your outlet. The EIA describes the grid as substations, transformers and power lines that connect power plants to customers.
Here is the journey in simple steps:
- Power plants make the electricity. The EIA says the cost of generating electricity is the largest part of the price.
- High-voltage lines move it long distances. According to the EIA, "Higher-voltage electricity makes long-distance electricity transmission more efficient and less expensive."
- Transformers change the voltage. Substations lower the voltage for the last part of the trip.
- Local lines deliver it to buildings. The EIA notes that distribution lines carry lower-voltage electricity, which is safer to use in homes and businesses.
Homes sit at the very end of that chain and each one uses a fairly small amount of power. Large industrial users are different. The EIA puts it this way: industrial consumers "use more electricity and can receive it at higher voltages, so supplying electricity to these customers is more efficient and less expensive."
The EIA also says the retail price for industrial customers is generally close to the wholesale price of electricity. In other words, factories pay close to what the power itself costs on the wholesale market. Homes pay for the power plus more of the cost of the local network that brings it to the door.
More broadly, the EIA says prices reflect the cost to build, finance, maintain and run power plants and the grid. Some for-profit utilities also include a financial return for their owners and shareholders.
How the gap looks in different states
The pattern is not the same everywhere. The table below shows July 2026 EIA averages for a mix of states.
| State | Residential | Commercial | Industrial | All sectors |
|---|---|---|---|---|
| California | 33.61¢/kWh | 30.56¢/kWh | 25.11¢/kWh | 30.71¢/kWh |
| Hawaii | 48¢/kWh | 43.63¢/kWh | 39.33¢/kWh | 43.28¢/kWh |
| New York | 29.9¢/kWh | 24.18¢/kWh | 10.81¢/kWh | 25.18¢/kWh |
| Texas | 15.88¢/kWh | 8.47¢/kWh | 7.07¢/kWh | 10.91¢/kWh |
| Pennsylvania | 21.72¢/kWh | 13.86¢/kWh | 11.04¢/kWh | 16.22¢/kWh |
| Michigan | 23.05¢/kWh | 16.46¢/kWh | 9.81¢/kWh | 17.43¢/kWh |
| Tennessee | 13.71¢/kWh | 13.43¢/kWh | 7.13¢/kWh | 12.21¢/kWh |
| Nebraska | 13.78¢/kWh | 9.39¢/kWh | 10¢/kWh | 10.83¢/kWh |
| Nevada | 12.77¢/kWh | 9.72¢/kWh | 10.04¢/kWh | 11.15¢/kWh |
| District of Columbia | 25.21¢/kWh | 23.88¢/kWh | 32.15¢/kWh | 24.03¢/kWh |
What this shows:
- In most states, homes pay the most. California, New York, Texas, Pennsylvania and Michigan all follow the national order.
- The size of the gap varies a lot. In Tennessee, the residential and commercial averages are close. In Texas and New York, homes pay far more than businesses.
- There are exceptions. In Nebraska and Nevada, industrial customers paid more than commercial customers in July 2026. In the District of Columbia, the industrial average was the highest of the three.
- High-price states are high for everyone. In Hawaii, even industrial customers paid more than homes in every other state in this table. The EIA says Hawaii's prices are high mainly because most of its electricity comes from petroleum fuels that must be imported.
Monthly state averages can move around from one month to the next. Treat one month as a snapshot, not a trend.
What this means for your household
You cannot switch your home to an industrial rate. But knowing why your rate is higher helps you read your bill and compare options.
- Check your actual rate. Divide your bill total by the kWh you used to see your all-in price per kWh. Compare it with your state's average.
- Ask about rate plans. The EIA notes that some utilities offer time-of-day pricing to cut demand at peak times. Whether that helps you depends on when you use power and on your utility's terms.
- Remember summer costs. The EIA says prices are usually highest in summer, when total demand is high. July is a summer month, so these figures reflect that season.
How this affects rooftop solar
When you use power from your own solar panels, you buy less power from the grid at the residential rate. That is why the residential price, not the all-sector average, is the number to look at when you think about home solar.
Credit for the extra power you send back to the grid works differently. Net metering and other solar programs vary by state and utility, and DSIRE keeps a database of current programs. Our guide on net metering vs. net billing explains how the credit rules change the math.
Also note that the 30% federal Residential Clean Energy Credit is not available for property placed in service after December 31, 2025. See is solar worth it without the tax credit for more.
To test numbers for your home, try our solar calculator. It uses EIA residential prices and PVWatts, a free production estimator from the U.S. Department of Energy's National Laboratory of the Rockies (formerly NREL). Our methodology page lists every assumption. Your real result depends on your roof, your usage, your utility and your installer's quote.
Bottom line
Homes pay more per kWh than businesses and factories mainly because delivering power to many small customers costs more. In July 2026, the U.S. averages were 18.31¢/kWh for homes, 14.53¢/kWh for commercial customers and 9.77¢/kWh for industry. The gap differs a lot by state, and a few places break the usual order. Check your own bill and your state page to see where you stand.
Sources
- 1.PVWatts Calculator
- 2.EIA Electric Power Monthly, Table 5.6.A
- 3.eia.gov/energyexplained/electricity/prices-and-factors-affecting-prices.php
- 4.eia.gov/energyexplained/electricity/delivery-to-consumers.php
- 5.DSIRE: Database of State Incentives for Renewables & Efficiency
- 6.IRS: Residential Clean Energy Credit
Get new articles by email
New articles and the monthly electricity price update. Unsubscribe anytime.
See our privacy policy.